About the Shared Outcomes Framework
How to understand and measure change across SMMI-funded programmes


SHARED OUTCOMES HELP DIOCESES UNDERSTAND whether their programmes and initiatives are making a difference in people’s lives and in the life of churches.
They were developed from the experience of dioceses monitoring their programmes and are used, where relevant, across programmes funded by Strategic Mission and Ministry Investment (SMMI).
Understanding change across our churches
Shared Outcomes provide a common framework for prayerful reflection on the changes taking place in our Church. They help us to:
- Measure change in people and churches
- Compare and share learning between programmes and initiatives
- Understand impact across the Diocesan Investment Programme (DIP) as a whole
- Use evidence to make decisions about what is working and where more support may be needed
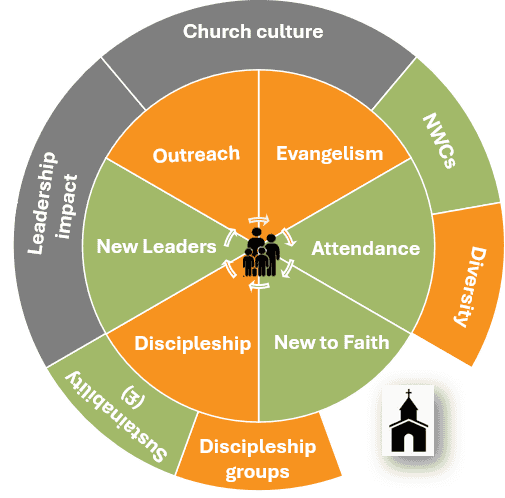
In the graphic below, you will see some of the principal areas of change and impact that we measure.
For further information about the shared outcomes approach to learning, visit the monitoring and evaluation page, which also includes practical tools, example spreadsheets and links to published evaluations.
The inner circle shows the journey of individuals: encountering the good news of Jesus Christ, finding belonging in a worshipping community, growing as disciples, and becoming leaders who enable others to flourish in faith.
The outer circle shows the journey of churches: strengthening leadership, cultivating a culture of welcome and outreach, growing new worshipping communities, becoming more diverse and representative, creating pathways for discipleship, and building the sustainability needed for mission and service locally and beyond.
The colour code indicates the definitions and tools used to measure these shared outcomes:
- Green – collected using standardised tools and definitions.
- Amber – measured using the optional tools and definitions provided or by using alternative tools and definitions.
- Grey – require bespoke measures.
This page will take you through each of the shared outcomes and the tools designed to measure them.
Green outcomes
Tracked using standardised tools, including Statistics for Mission and Online Parish Finance Returns.
Attendance change
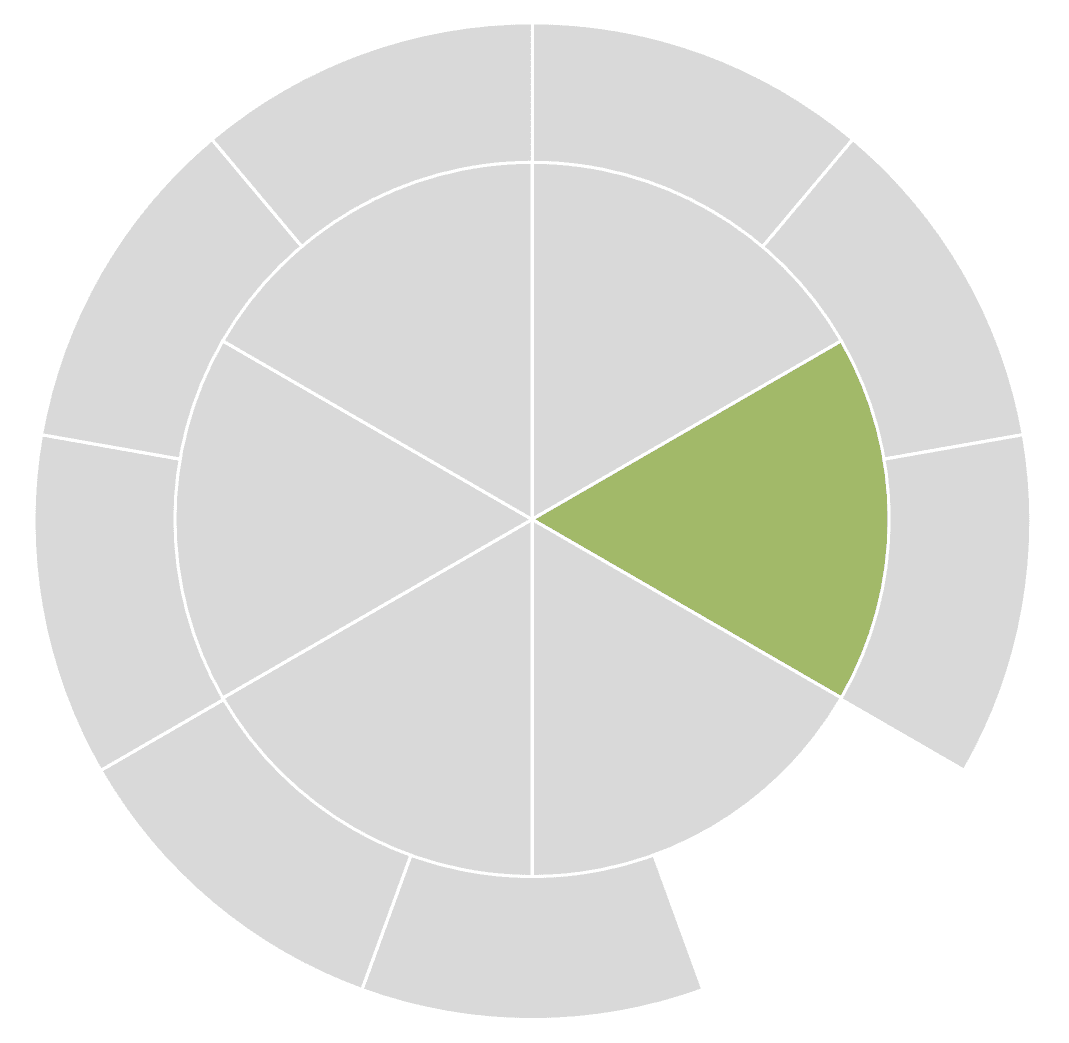
Number of adults (18+) who attend regularly – at least once a month – or who would do so if not prevented by illness or temporary absence.
Number of children and young people in the worshipping community (under 18s).
How do churches track this?
All churches track this annually through Statistics for Mission.
Churches with high levels of investment generally track this more regularly. They may share updates with their diocesan team once a quarter. They may use church management software to track attendance on a weekly basis. Average weekly attendance is often also tracked in programmes, but isn’t the shared outcome.
Please note, it is often important to see the attendance growth in the light of the numbers of attendees who are new to church or returning to church. See the Discipleship section below for more information about this.
Use of statistics for mission is standard for all churches
Further guidance and FAQs
Visit the Attendance Change page for further information on the definition and good practice around measuring this and for an optional spreadsheet for churches to use to list attendees.
Number of new worshipping communities
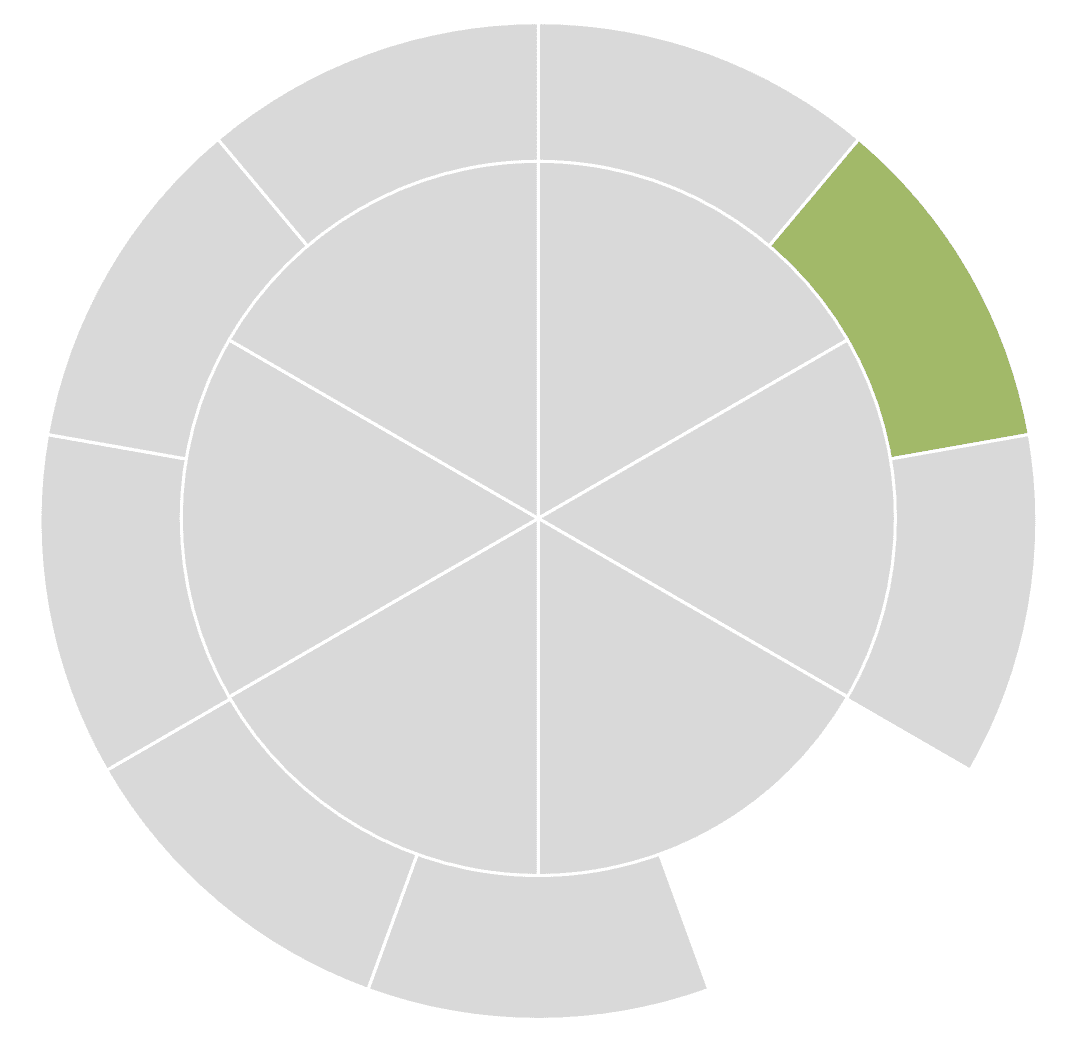
The number of newly started, regular (at least monthly) gatherings for worship, aimed at those who are new to faith.
How do churches track this?
All churches track this annually through Statistics for Mission.
Churches with high levels of investment may track this more regularly, for example through quarterly updates shared with their diocesan team.
Use of statistics for mission is standard for all churches.
Further guidance and FAQs
Visit the New Worshipping Communities page for further information on the definition and good practice around measuring this and for an optional spreadsheet for churches to use to list attendees.
Number of new leaders
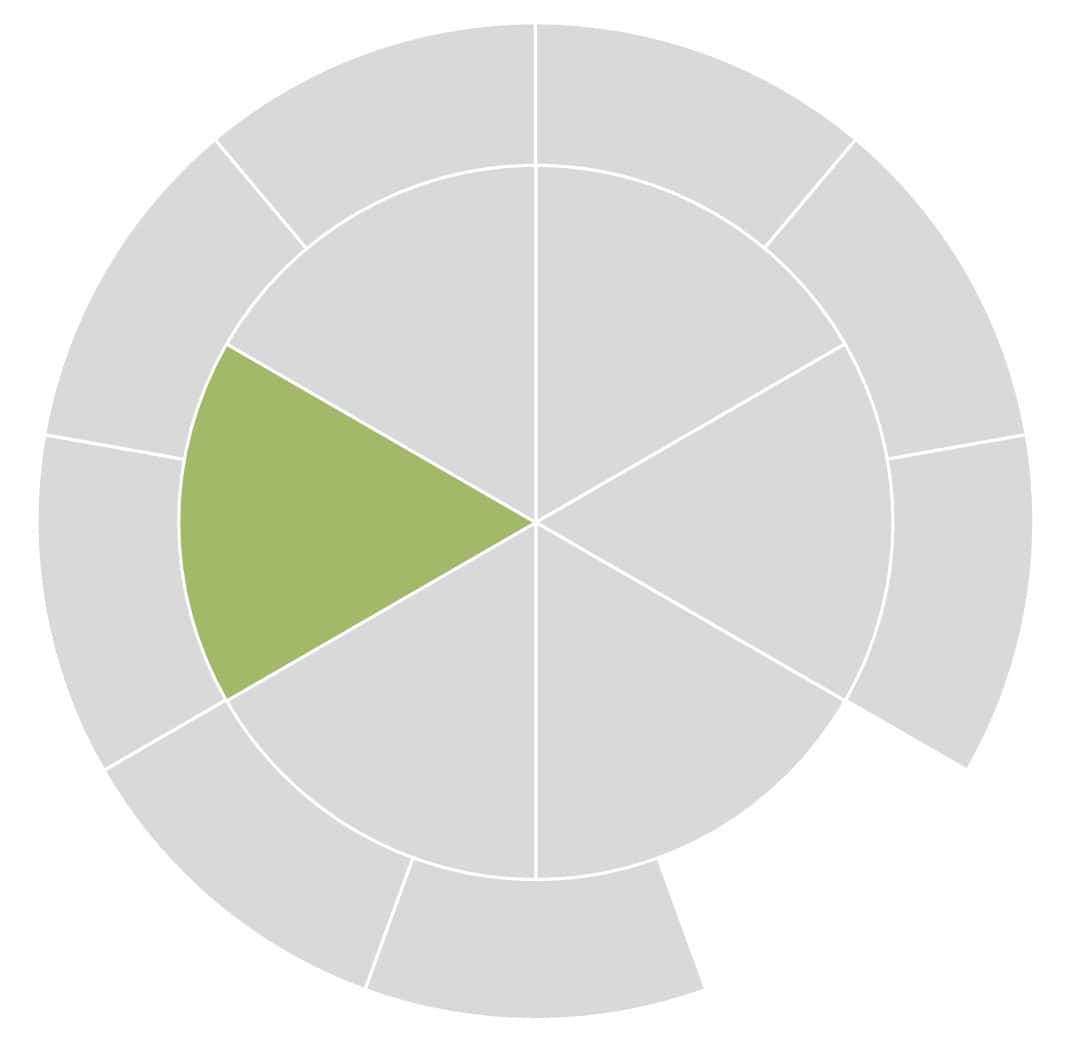
The number of people who have newly taken on a recognised ministry role, such as discerning a vocation to ordained ministry, becoming licensed, authorised or locally commissioned, or starting a Church-recognised or funded ministry programme. This may include young people.
This measure relates to people leading ministry, not those assisting in ministry, although many dioceses also track those numbers.
How do churches track this?
These figures are often tracked through a quarterly spreadsheet.
SMMI programmes generally track particular types of leaders, according to their initiatives. For example:
- Ordained/Lay
- CYP leaders
- Leaders from Global Majority Heritage
- Leaders from estate contexts
Some dioceses also track volunteers who are not leading a ministry, but keep these separate.
The diversity of leaders is also important, particularly in areas where they aren’t currently representative of the population. Use Contact us to speak to the Vision and Strategy team about tracking this.
Financial sustainability
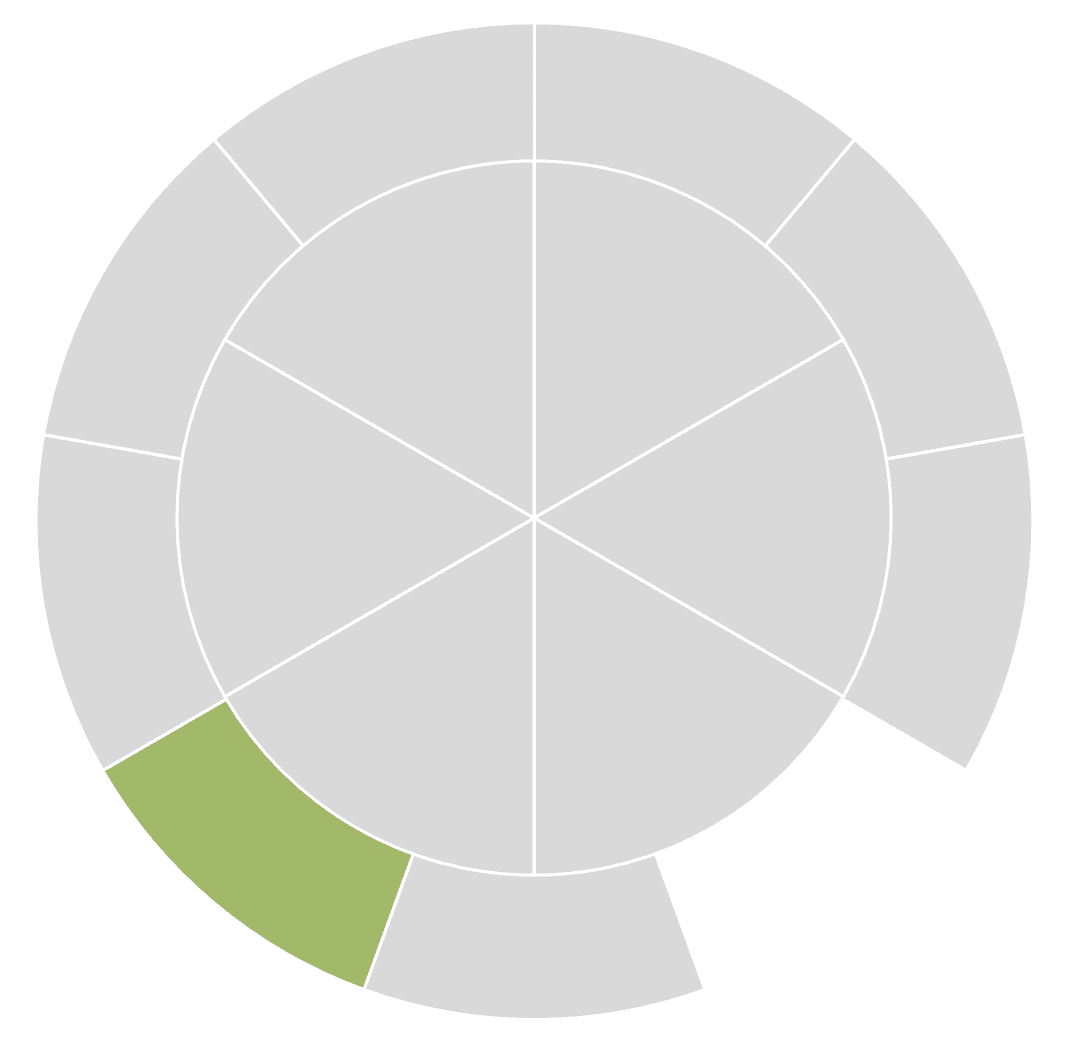
Total giving: the total given to the parish and any related charities or project funds, including regular and one-off gifts and Gift Aid. It is taken from, or aligned with, Parish Finance Returns.
Number of regular givers: the total number of people who give regularly to the church, charity or fund, taken from or aligned with Parish Finance Returns.
Annual support or investment: locally generated church income minus direct and indirect non-capital costs.
How do churches track this?
Total giving and the number of regular givers are recorded through Parish Finance Returns. Churches receiving higher levels of investment generally track these measures more frequently. They may also share updates with their diocesan team each quarter.
Annual support or investment uses data from Parish Finance Returns together with budget information and diocesan calculations to calculate consistent figures.
The use of Parish Finance Returns is standard across all churches.
Further guidance and FAQs
Visit the Financial Sustainability page for more information about these measures, including definitions and good practice for tracking and reporting them.
Numbers new to faith
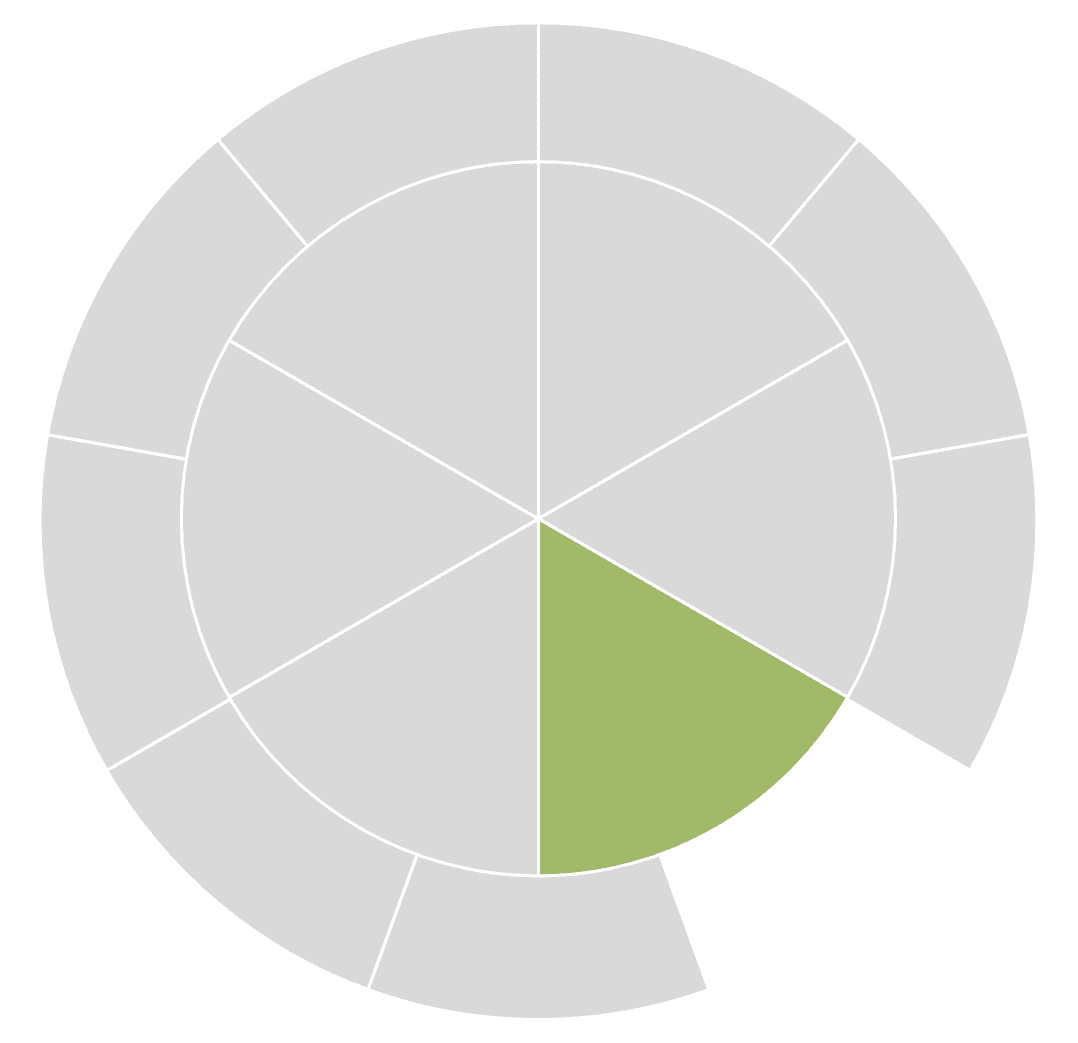
The number of baptisms of people aged 11 and over, confirmations, and other first-time public declarations of faith, using Statistics for Mission and local records.
The number of baptisms of children aged 0 to 10, using Statistics for Mission.
How do churches track this?
All churches track this annually through Statistics for Mission.
Churches receiving higher levels of investment may track this more regularly, for example through quarterly updates shared with their diocesan team.
The use of Statistics for Mission is standard across all churches.
Further guidance, FAQs and a tool
Visit the New to Faith page for more information about these measures, including definitions and good practice for tracking and reporting them. The page also includes an optional spreadsheet that churches can use to record public declarations of faith.
Amber outcomes
Tracked using recommended tools, although dioceses may choose to use alternative tools or approaches, depending on their needs.
Scale of community engagement
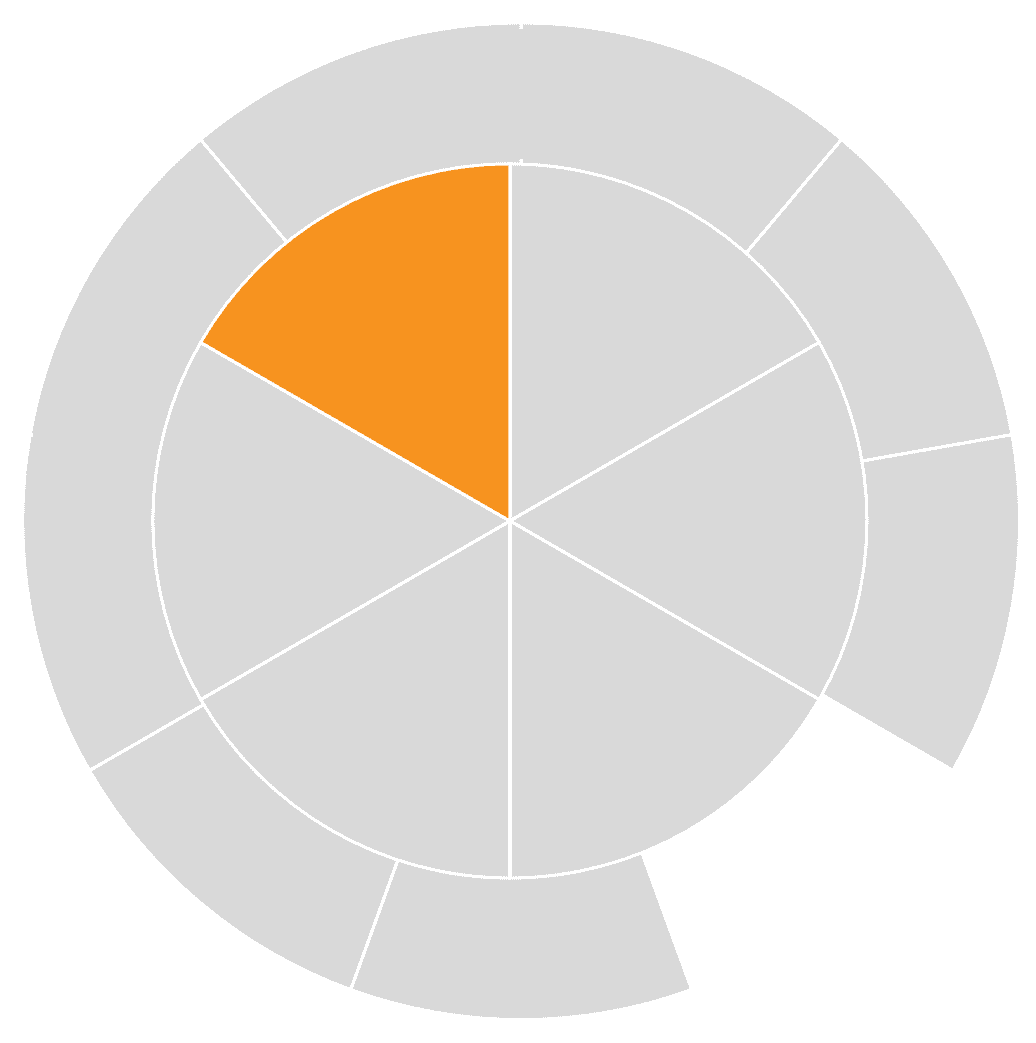
The number of members of the local community who benefit from an activity designed to engage with them, where the church has been a significant contributor. This counts every interaction or participation, rather than unique individuals.
Stories collected using the “Most Significant Change” approach.
How do churches track this?
There are two main ways to track these figures, depending on local needs. Both are optional.
- Participation Tracker: Churches can use a Participation Tracker to record participation on a weekly basis. This generates a chart showing growth over time. Contact the Vision and Strategy team to add this to Online Parish Returns.
- Quarterly reporting: Churches can record quarterly information about the frequency of activities. This can currently be collected through a spreadsheet or Microsoft Forms. Contact the Vision and Strategy team to set this up.
Stories can also be collected to support learning and reflection using the “Most Significant Change” approach.
These tools can also be used to track evangelism activities.
This area is important in the life of the church, but churches or dioceses may use alternative approaches to track and measure this.
Scale of evangelism
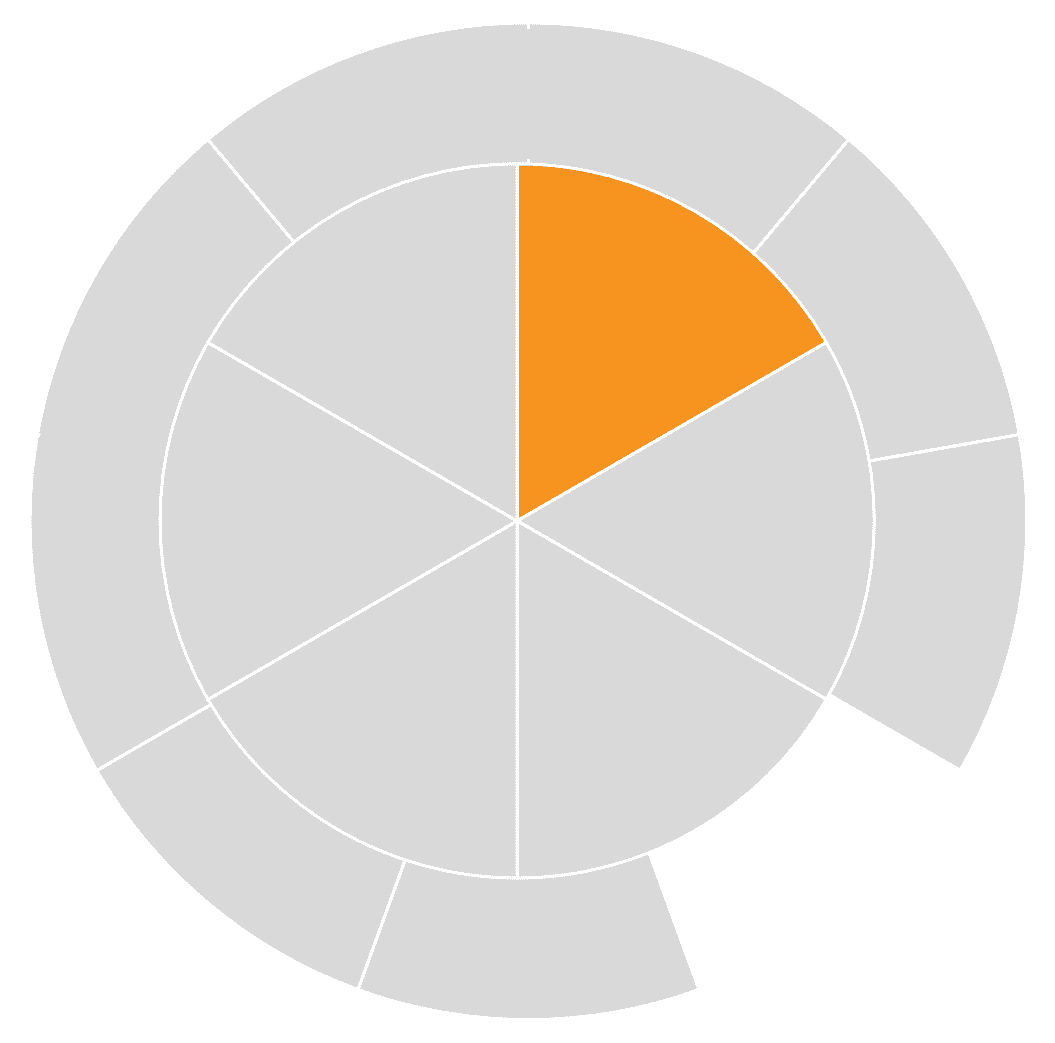
The number of people taking part in an activity whose purpose is to present Jesus Christ to people who are not regular attendees. The activity includes an opportunity for participants to make a personal response.
Stories are collected using the “Most Significant Change” approach.
How do churches track this?
As with community engagement, there are two main ways to track these figures, depending on local needs. Both are optional.
- Participation Tracker: Churches can use a Participation Tracker to record participation on a weekly basis. This generates a chart showing growth over time. Contact the Vision and Strategy team to add this to Online Parish Returns.
- Quarterly reporting: Churches can record quarterly information about the frequency of activities. This can currently be collected through a spreadsheet or Microsoft Forms. Contact the Vision and Strategy team to set this up.
Stories can also be collected to support learning and reflection using the “Most Significant Change” approach.
This area is important in the life of the church, but churches and dioceses may choose alternative approaches to measure and track it.
Scale of discipleship groups

The number of people in the church’s worshipping community who are part of a group or programme intended to help them grow as Christian disciples.
How do churches track this?
This is often recorded in a spreadsheet on a quarterly or annual basis. Some churches use church management apps.
There is no standardised tool for this.
Individual discipleship
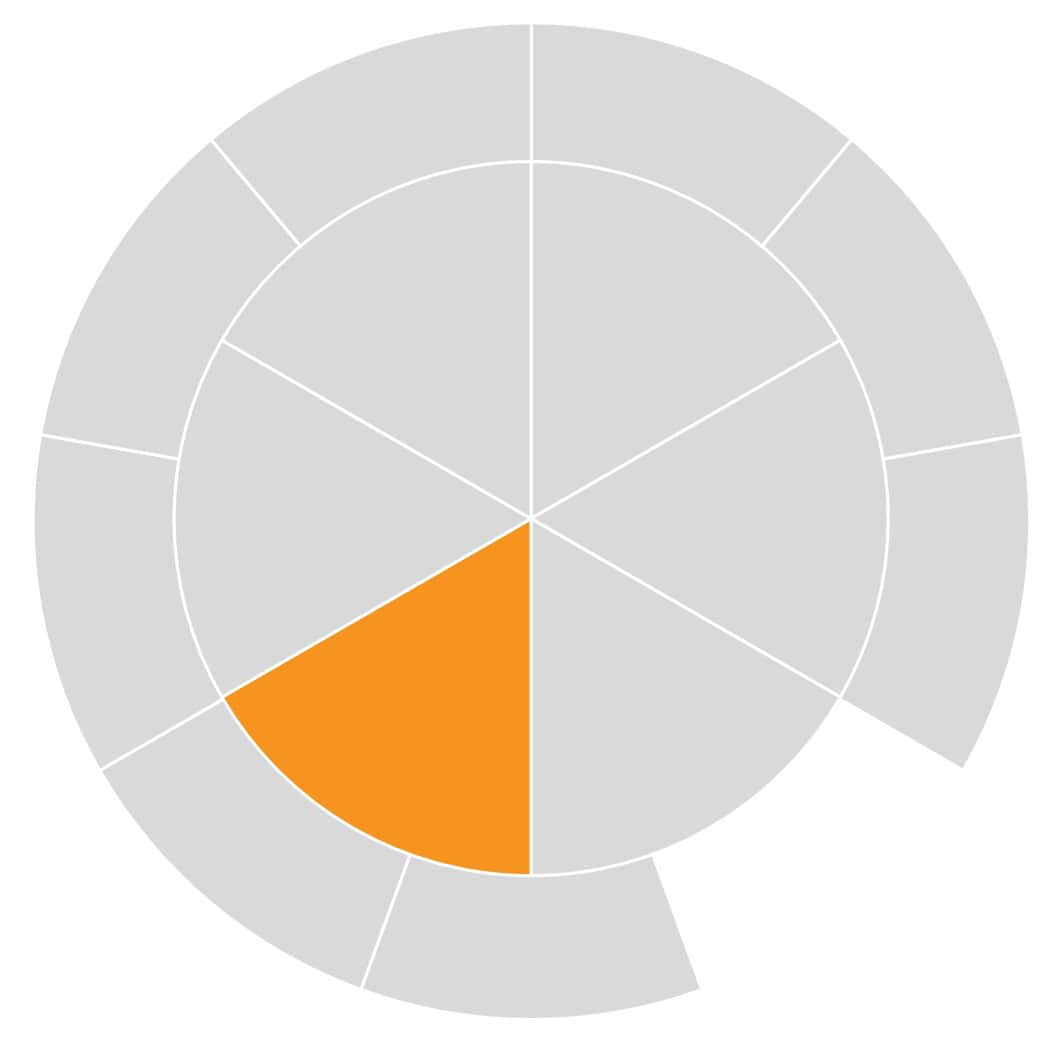
Individual growth in following Jesus’ teaching across all areas of life. Changes in discipleship are assessed through survey questions covering: the hallmarks of faith; engagement in regular spiritual practices; supportive and accountable relationships; sharing faith in everyday life; and exploring and living out personal calling. People are also asked whether they are new to church or returning to church.
How do churches track this?
Churches can use the Church Development Tool, which is available 11 months a year. They can do it annually or every two to three years. Dioceses can make the tool available through Online Parish Returns. Church leaders and dioceses can view charts showing survey responses and trends over time.
This tool is optional for churches.
Diversity
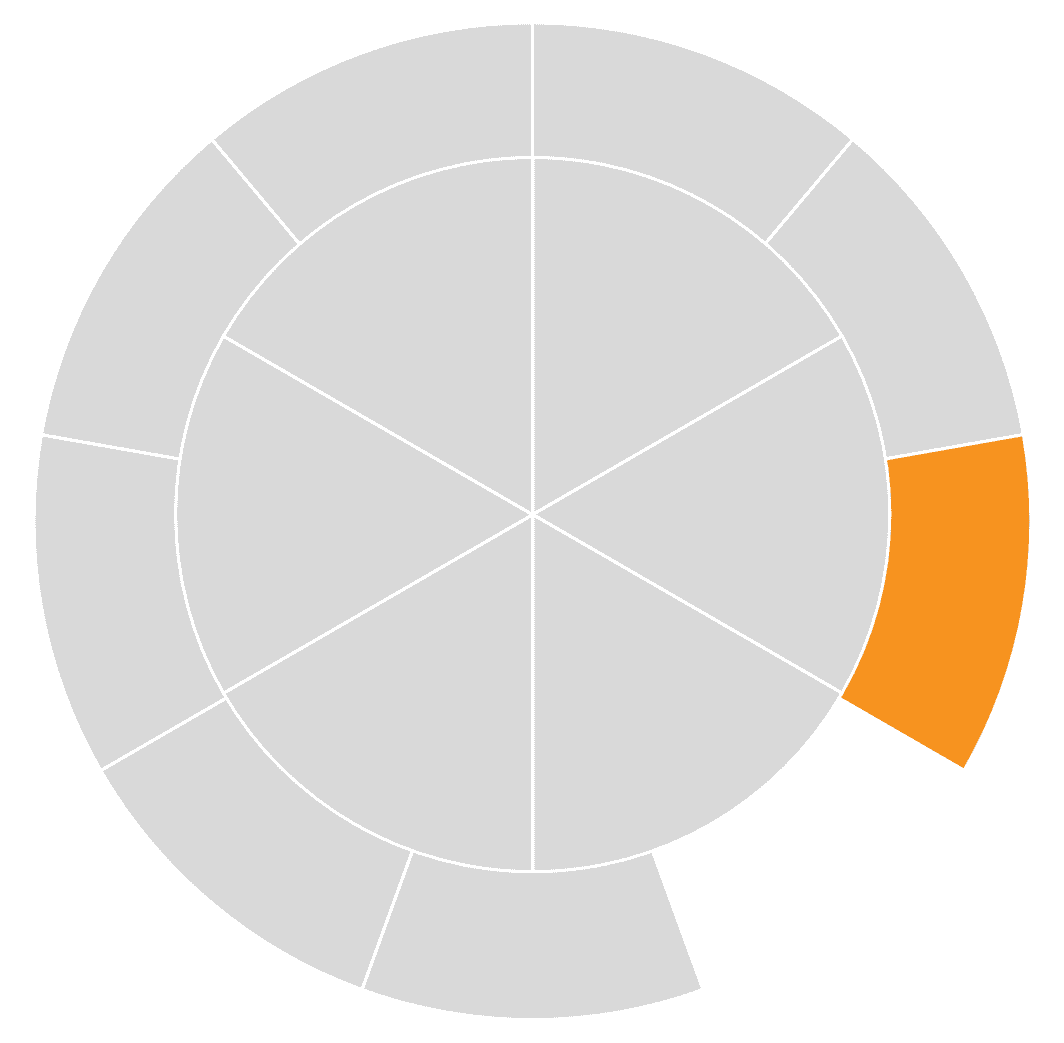
Changes in diversity as reflected in responses to congregational survey questions.
How do churches track this?
Churches can use the Church Development Tool, which is available 11 months a year. They can do it annually or every two to three years. Dioceses can make the tool available through Online Parish Returns. Church leaders and dioceses can view charts showing survey responses and trends over time.
This tool is optional for churches.
Grey outcomes
Tracked using locally chosen approaches. Dioceses use a range of methods to understand changes in leadership and church culture, often tailored to their strategy and context. Examples of approaches are available.
Leadership impact and resilience and church culture
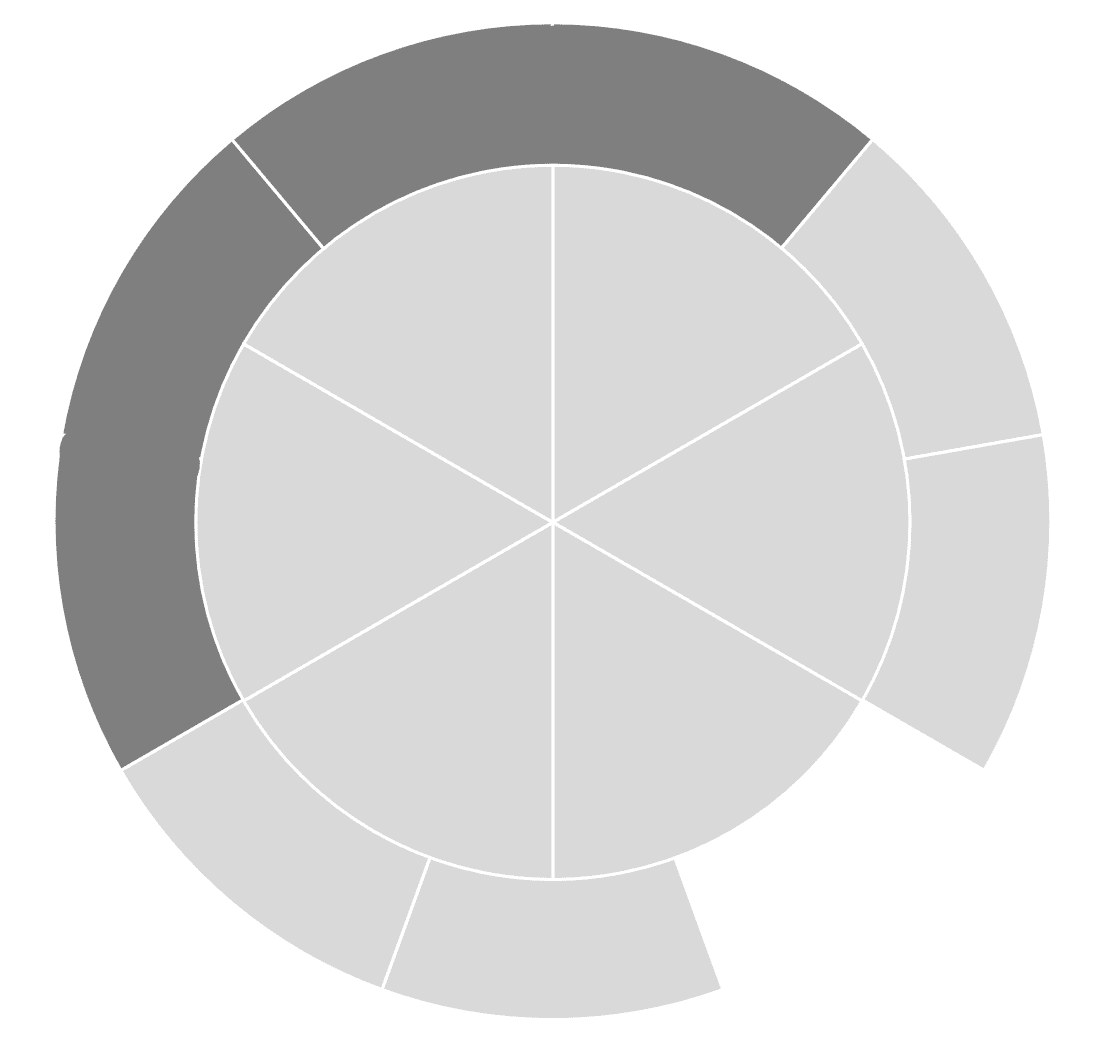
Dioceses identify the changes in leadership and church culture needed to achieve their strategy. With support from the Vision and Strategy team, they then determine how these changes will be understood and monitored over time.
How do churches track this?
Some dioceses have identified progress markers in order to support them to identify the process of change. Other dioceses have identified questions that they will look at through most significant change.
These tools are bespoke for each dioceses. The Vision and Strategy team can share examples and support dioceses to develop these in line with their own strategies.
For more on how the outcomes framework supports shared learning, visit the Using the Shared Outcomes Framework page.
You can also download guidance notes on the shared outcomes framework below:
Further support

Support with the shared outcomes can be requested through Contact us.